Prerequisites:
Soil Survey Data Modelling
The CSV file, soil_survey.csv, contains denormalized data that came from a relational database. Next, we will transform table-based relational model into a graph data model that will consist of nodes and relationships between them.
The resulting model will be more intuitive and easier to understand. It will express different aspects of the graph not in terms of how data is stored but how different entities are related to one another, as in how they affect one another - very much like objects in real life.
Here’s a snapshot of the original denormalized data that we found in MySQL:
mysql> select * from soil_survey order by rand() limit 3;
+-------------+------------+-----------+----------+--------------+----------+---------------+---------------+---------------+--------------+
| Hort_Client | Contractor | Region    | Locality | Soil_Service | Solution | Soil_Issue    | Date_Reported | Date_Actioned | DaysToAction |
+-------------+------------+-----------+----------+--------------+----------+---------------+---------------+---------------+--------------+
|         168 |       2245 | Swifford  | 2130     |        51277 |     2118 | Compaction    | 2010-12-27    | 2011-03-14    |           77 |
|         164 |       2503 | Northbury | 502      |          545 |     7866 | Acidification | 2010-06-28    | 2010-12-06    |          161 |
|         157 |        777 | Swifford  | 22       |           67 |     5739 | Erosion       | 2013-12-23    | 2014-04-14    |          112 |
+-------------+------------+-----------+----------+--------------+----------+---------------+---------------+---------------+--------------+
3 rows in set (0.01 sec)
So what does the data found in soil_survey.csv represent?
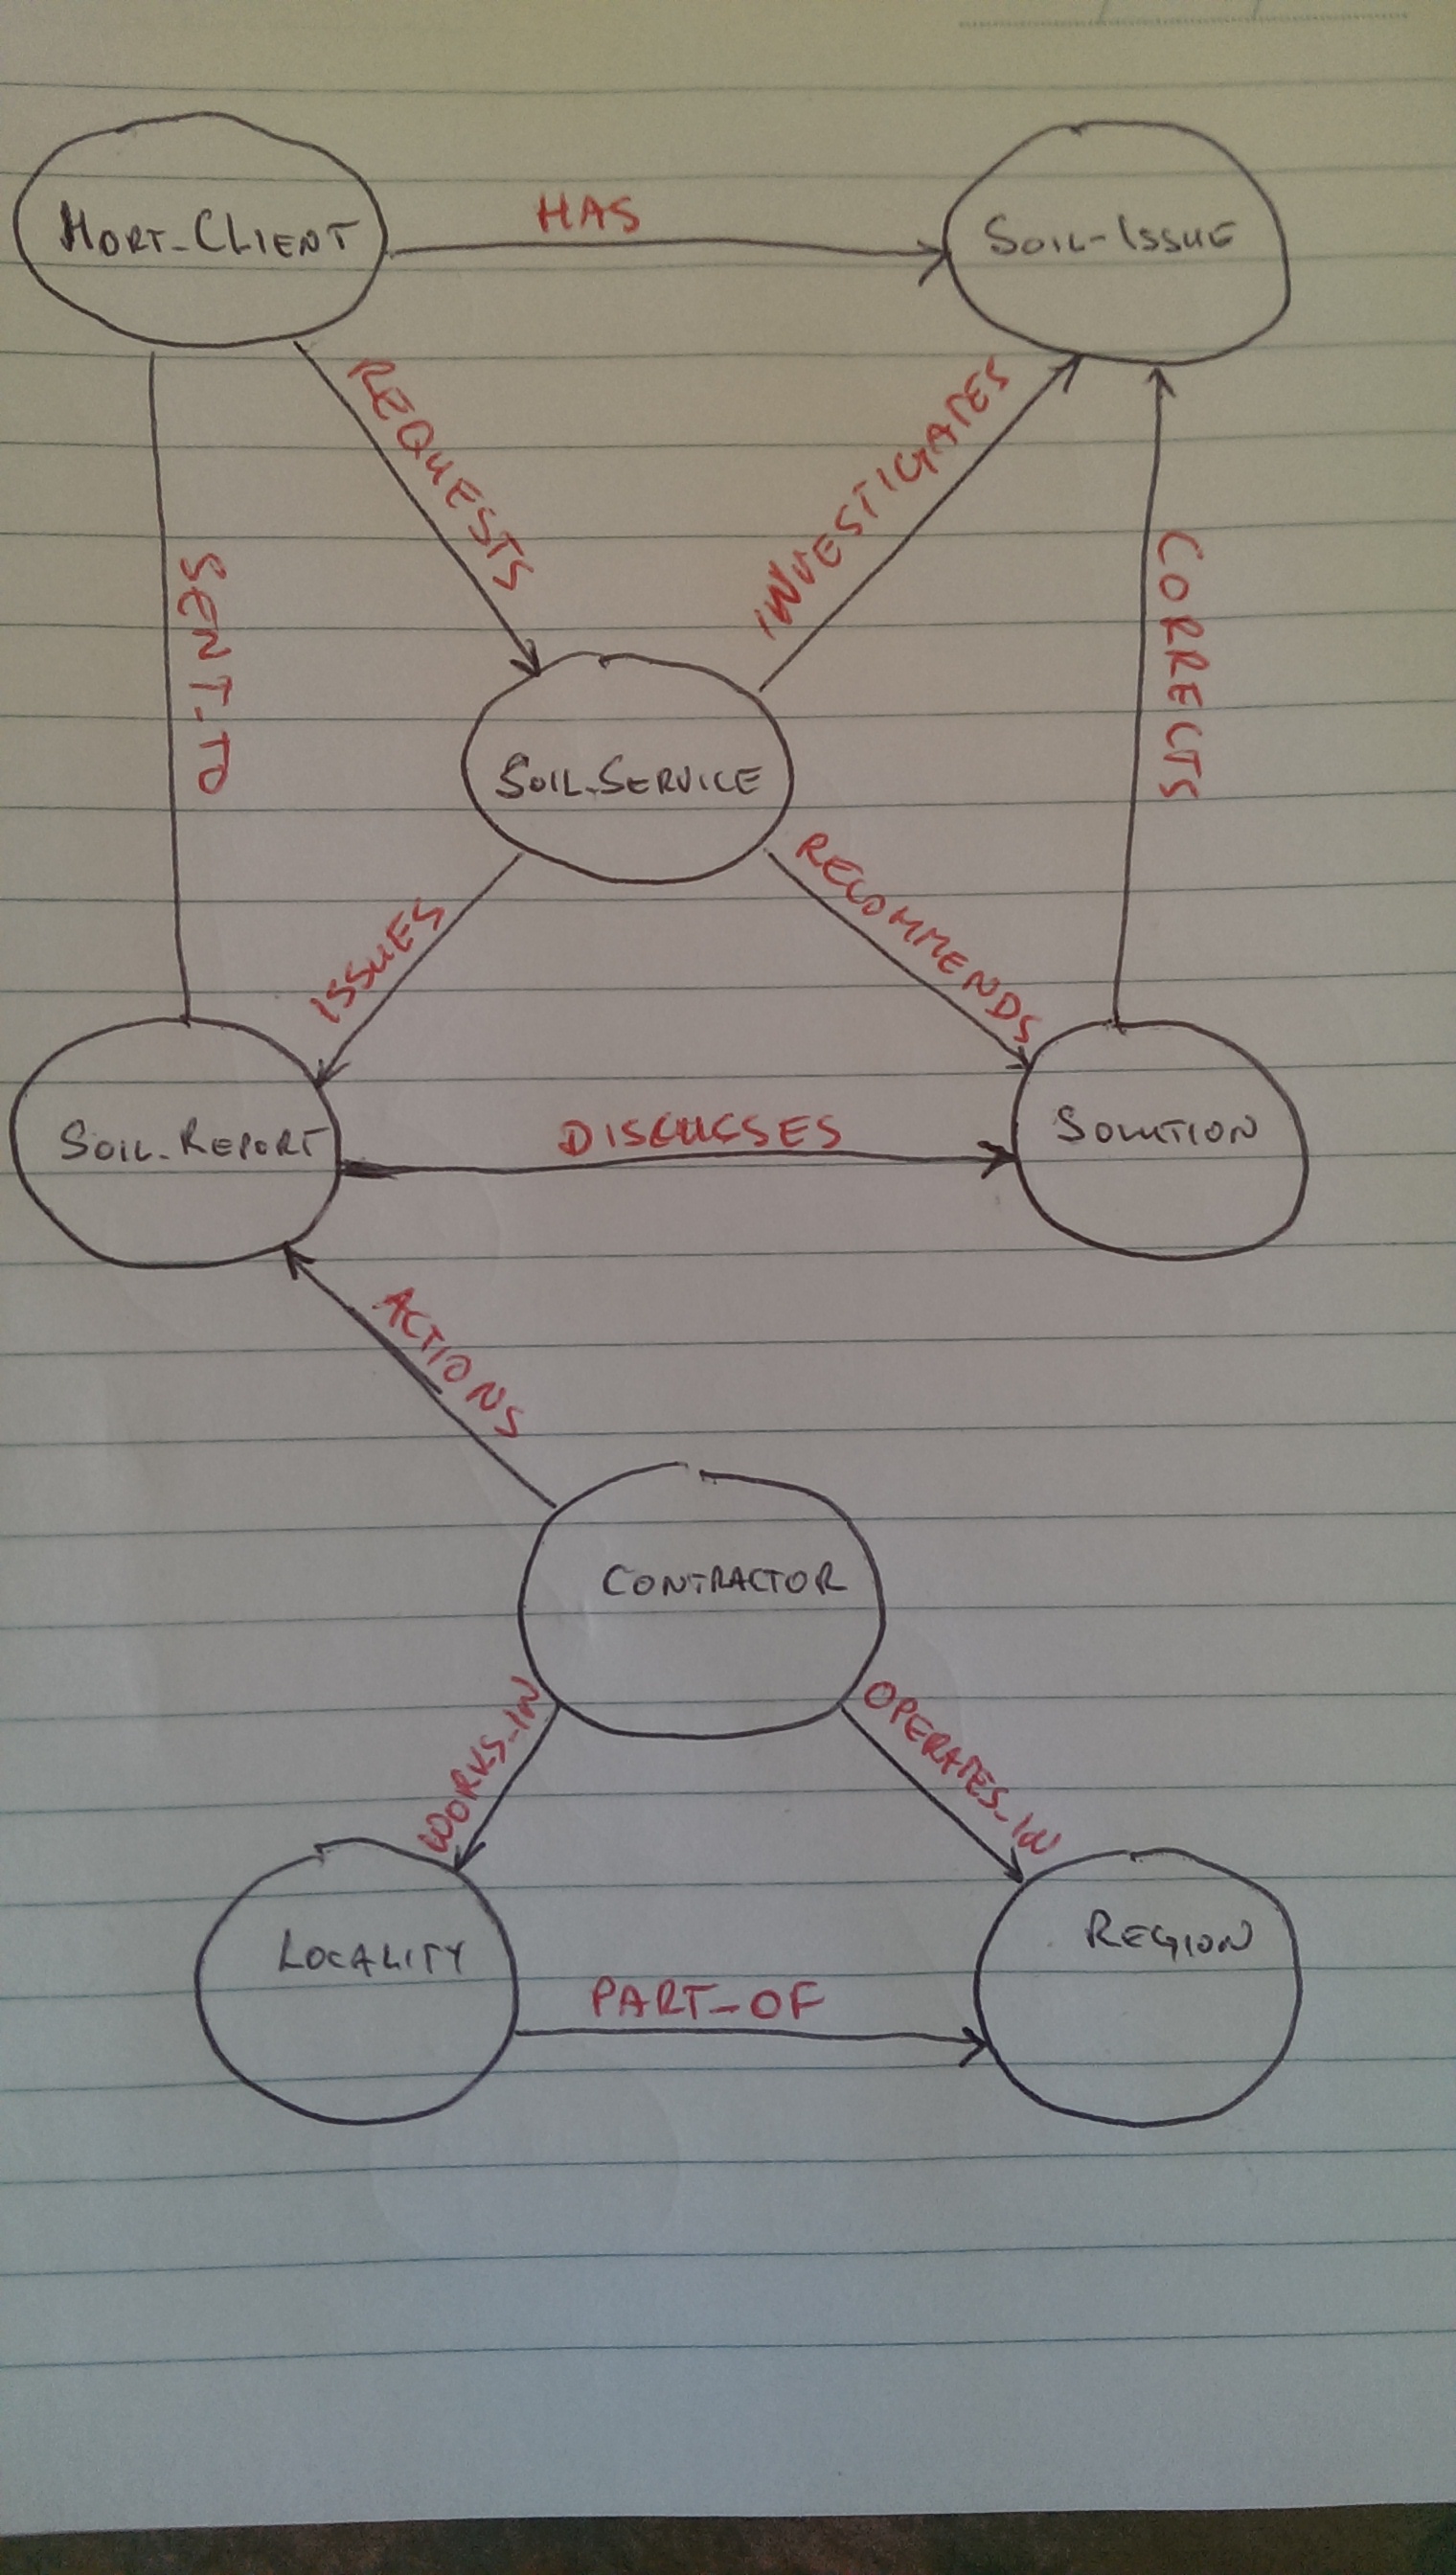
Firstly, we start with Hort_Client, a horticultural enterprise that is perhaps a cherry orchard, a family apple farm, or a grape vineyard. The Hort_Client requests a comprehensive soil test,Soil_Service from a soil testing consultant. The consultant visits the property and identifies a number of Soil_Issue problems. The consultant goes back to the office, has a look at the results and being the expert in soil science puts forward a Solution for each Soil_Issue it finds on the property. A Soil_Report addresses individual Soil_Issue with its corresponding Solution.
The relational/CSV data does not explicitly define the existence of a Soil_Report object/table, so we will need to create it in the graph. We do have several properties that can be used to create this node, such as Date_Reported, Date_Actioned, and DaysToAction.
Once the Hort_Client receives a Soil_Report, then it engages a Contractor who hails from Locality and is licensed to operate anywhere within its Region.
Date_Actioned refers to the date that a Contractor successfully implemented the Solution for a given Soil_Issue at the property of Hort_Client. DaysToAction is a counter of the delay between Date_Reported and Date_Actioned. There are some issues which have higher priority then others and a greater need of urgency than others. We will use this property to benchmark Contractor’s performance and take note of recurring anomalies.
Anomaly is basically an event, or pattern of action that strays from what is expected. Once the data is in the graph, we can investigate these kinds of behaviours in more details.
Proposed Data Model for Soil Survey Graph
We now have a complete graph data model that we’ll use to populate a Neo4j graph database